Statistical guideline for a financially successful movie taking inflation into consideration
Statistical guideline
| Statistical guideline for a financially successful movie |
|---|
Introduction:
Movies provide an escape from reality and are loved by everyone. It’s no surprise that the movie industry is a major player in the global entertainment market, with the global box office worth a whopping $42.2 billion in 2019. But what makes a movie financially successful? Is it the length of the film, the star power of the actors, the genre, or the budget? In this data story, we will explore these questions using data from a subset of movies released in the US between 1980 and 2010. We’ll be using the CMU Movies dataset and supplementing it with additional data from Wikidata, TMDb, and IMDb. By measuring the financial success of a movie using the profit feature (defined as the difference between revenue and budget) and the return on investement feature, we hope to uncover the key factors that drive a movie’s profitability.
The dataset:
The CMU movies dataset appears to contain information about movies, including metadata such as the movie’s Wikipedia and Freebase IDs, name, release date, box office revenue, runtime, languages, countries, and genres. We augmented it with additional data from external sources. This included movie ratings from IMDB and budget and revenue data from wikidata and TMDb. These data sources were scraped in order to obtain budget and revenue information for movies from the United States. Which will be then used to understand the financial success of the movies in the dataset.
Before analyzing the data, some preprocessing steps were necessary to ensure that the data was clean and ready for analysis. When we talk about financial success, the first problem that comes to mind is inflation. Inflation is an important factor to consider when analyzing financial data, especially when comparing data from different time periods. This is because inflation can affect the value of money over time, making it difficult to accurately compare financial data from different periods without taking it into account.

For example, if we consider a movie A that was released in the 1980s and made $50 million at the box office, and another movie B was released in the 2010s and made the exact same amount of money.
Without taking inflation into account, it might seem like both movies were equally financially successful. However, due to the effects of inflation, the $50 million that Movie A made at the box office may not be equivalent to the $50 million that Movie B made in terms of purchasing power. This is because the value of money can change over time due to inflation, meaning that the same amount of money may be worth more or less in different time periods.
By accounting for inflation, it is possible to get a more accurate picture of the financial performance of both movies. For example, if inflation was 2% per year between the 1980s and the 2010s, the $50 million that Movie A made at the box office in the 1980s would be worth around $129 million in the 2010s. In this case, it would be clear that Movie B was more financially successful than Movie A, even though both movies made the same amount of money at the box office.
This inflation adjustment was performed using the cpi library, such that all our financial data was adjusted according to the year 2010. Once all datapoints in our dataset are comparable, let’s dive in and look at our data.
Exploratory data analysis:
We start our data story by plotting the distribution of movies over the years in our dataset, with a focus on the relative prevalence of each genre within each year.
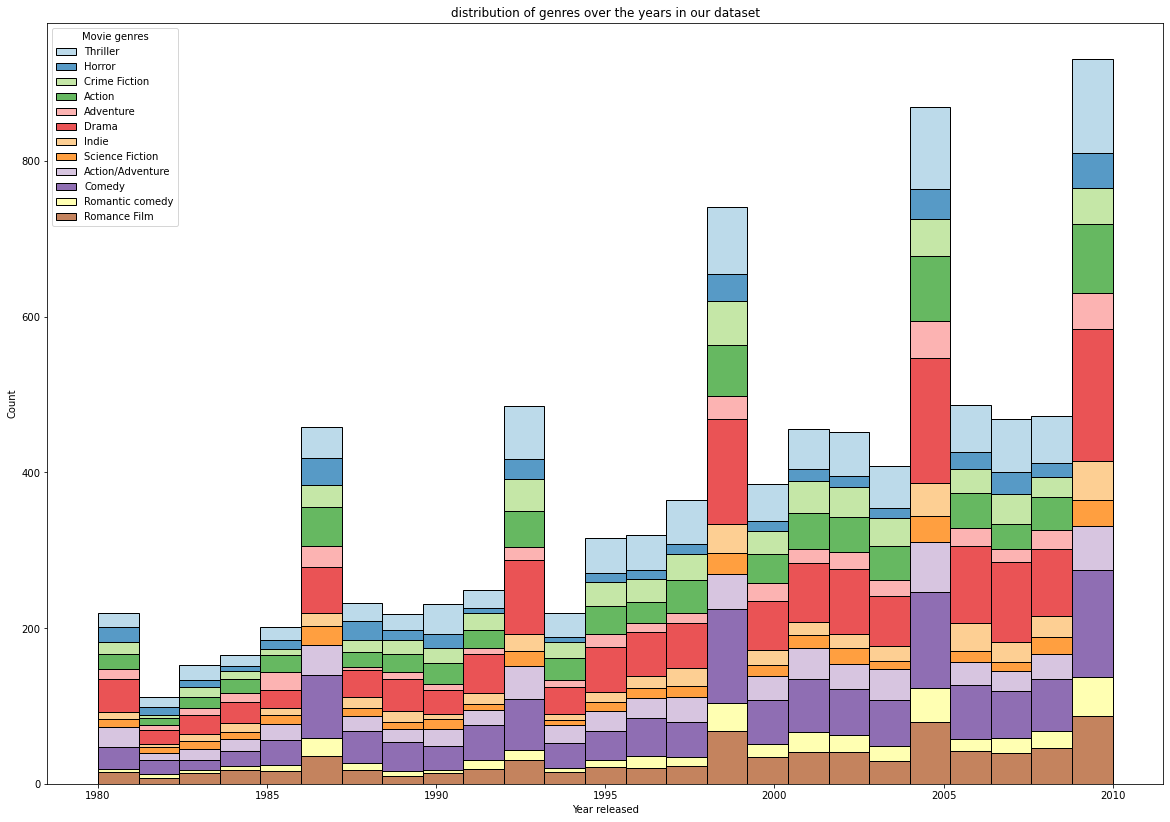
The graph reveals a repeating pattern in which there is a local maximum of movies produced every 5 years. This means that within a five year period, there is a relatively high number of movies produced, followed by a relatively lower number of movies produced in the following years. This pattern is repeated over time, with the number of movies produced in a particular year fluctuating between high and low values.
There are several potential reasons for this pattern. One possibility is that there are certain factors that influence the production of movies, such as technological advancements, cultural trends, and economic conditions, which may fluctuate over time and lead to changes in the number of movies produced. Another possibility is that there are cyclical patterns in the movie industry, with certain genres becoming more popular at certain times and then declining in popularity before increasing again, resulting in changes in the number of movies produced. It is also possible that this pattern is simply due to random fluctuations and does not have any underlying cause.
Regardless of this, we also notice that drama has approximately the most number of movies in each year followed respectively by comedy, thriller, action. One might assume that these biggest genres are the ones that influence the most the financial success of a movie, let’s see if that is indeed the case.
How does the different features of a Movie affect the Movie box office revenue and the return on investment rate ?
After computing the correlation coeficcient of each pair of numerical feature, we obtain the following heatmap
While interacting with the heatmap, we found several interesting correlation coefficients. However, the most relevant independent pair for our purposes is the revenue and budget, which had a value of 0.56. By “independent,” we mean that one feature is not used to calculate the other. However, we are missing out on important feature in the above heatmap, “The genre of the movie “.
If you’re a movie buff, you know that genre is a crucial element that shapes the overall feel and tone of a film. In our data, genre is represented as a list of strings. But how do we model this in a regression analysis? One option is to use a one-hot encoding scheme, where each unique genre gets its own separate column. However, with 265 initial genres, this could create a very large and unwieldy dataset.
To streamline the process and avoid losing important information, we’ll take a few steps to reduce the number of genres. First, we’ll merge similar genres together to cut down on redundancy. Next, we’ll encode the least common genres in a new variable, helping us to focus on the most prominent categories. Finally, we’ll use recursive feature selection to identify the 20 most meaningful genres that can help explain the patterns in our dataset. By following these steps, we can strike the right balance between detail and simplicity in our analysis.
Let’s see how does this translate when we perform a linear regression on the remaining most meaningful features.

Are you curious about what factors drive movie revenue? Look no further! This graph reveals the key players and how they impact the bottom line. On the right side of the graph, you’ll see features that boost revenue. On the left side, you’ll see factors that drag it down.
Budget is a top performer, with a coefficient of 0.5. This means that if all predictors take mean values an increase of budget by 1 leads on average to an increase by 0.5 of the revenue. But budget isn’t the only factor at play. Some genres, like Buddy films, Romance films, and Suspense, really stand out. Movie runtime and release year also have an impact, although runtime tends to be positive while release year is negative. This could be because older movies are less likely to be shown in theaters as time goes on.
Overall, this graph gives us a clear picture of the forces shaping movie revenue. Whether you’re a filmmaker or just a fan, it’s worth taking a closer look to understand what makes a movie a box office hit.
Furthermore, When it comes to movies, it’s important to remember that they often belong to multiple genres at the same time. While we previously examined the independent effect of each genre on revenue, the reality is that what makes a movie enjoyable is often the combination of genres. Think about your favorite films – chances are, they didn’t just belong to one genre, but rather blended elements from a variety of genres to create a unique and memorable viewing experience. So, while it’s helpful to understand the individual impact of each genre, it’s also important to consider how different genres can work together to create a successful and satisfying movie.
Uncovering the most common Pairs of the 20 Meaningfull genres present in our most successfull movies:
In order to visualize this concept, we need to define a metric for selecting a subset of successful movies. One way to do this is by only considering films that at least double their budget – this is where the return on investment comes into play.
Upon selecting our subset, we notice from our interactive sanky diagram plot that the 3 most frequent pairs of genres in this subset are (action, adventure), (action, buddy film) and (coming of age, action). The sanky diagram is a type of graph that is used to visualize the frequency of co-occurring events. In this case, the events are the pairs of genres that appear most frequently in our subset of successfull movies.
Making a movie represents a lot of money, so one might want to maximise its return on investment when making a movie
The bar plot indicates that the movie genres with the highest return on investment (ROI) are Cult, Mystery, and Indie, with ROIs of approximately 60, 50, and 50 times the budget, respectively.The interactive bar plot suggests that these genres are less financially successful compared to Cult, Mystery, and Indie. So, you might need to choose wisely.
Presence of notorious actors :
You’ve selected the genre, runtime, and release year for your movie. Now it’s time to cast your actors. Should you splurge on a big-name star or go with a lesser-known actor, like your cousin who’s trying to make it in New York?
We’ve done the research for you. By querying all actors who have won prestigious awards and mapping them to movies, we were able to determine whether a movie’s cast included an award winner prior to its release. Using propensity score matching with exact matching on genre, we compared the performance of movies with award-winning casts to those without.
The results were clear: having an award-winning actor in your cast can have a positive effect on your movie’s success. Sorry, cousin – looks like Leo wins this round.

Conclusion :
We wanted to uncover the secrets behind the financial success of movies, so we conducted a study analyzing a diverse dataset of films released in the US between 1980 and 2010. Our data included information on metadata, box office revenue, runtime, language, country, and genre, as well as budget and revenue data from Wikidata and TMDb. We used movie box office revenue and return on investment as our metrics for financial success.
Our analysis yielded some interesting insights. For one, budget appeared to be a major factor in a film’s financial success. We also found that having a cast with prestigious awards under their belt seemed to have a positive effect.
But it’s important to note that there are many other variables at play when it comes to a movie’s financial performance. Marketing strategies, competition, cinematography, distribution, and audience demographics are just a few examples. Further research could be conducted to more fully understand the impact of these and other confounders on the financial performance of movies.